Cattle Gestation Chart: What is it, How to Use, and Benefits

Calculating calving dates for a single cow can be time-consuming. Doing it for an entire herd? That’s a daunting task that can eat up hours of a rancher’s valuable time. Opening a calculator or performing complex math for each cow is not just tedious—it’s inefficient.
This is where cattle gestation charts come in handy. These simple tools eliminate the need for repetitive calculations, allowing ranchers to quickly determine expected calving dates based on breeding times.
In this blog post, we’ll explore what a cattle gestation chart is, how to use it, and why it’s an invaluable asset for any cattle rancher. So put away that calculator and let’s get started!
What is a cattle gestation chart?
A cattle gestation chart is a simple table designed to help ranchers, and veterinarians, predict and plan for the birth of calves based on breeding dates. The chart typically displays a correlation between the date of breeding (often called “date of service”) and the expected calving date, accounting for the average gestation period of cattle, which is approximately 283 days.
These charts are structured to cover an entire year, allowing for any possible breeding date. To use this chart, you would find the breeding date in the “Date of Service” column and read across to find the corresponding “Calf Due” date. For example, if a cow is bred on Jan 1, the calf would be due on Oct 10, according to this chart.
| Date of Service | Calf Due Date | Date of Service | Calf Due Date | Date of Service | Calf Due Date |
|---|---|---|---|---|---|
| 1-Jan | 10-Oct | 1-May | 7-Feb | 1-Sep | 10-Jun |
| 2-Jan | 11-Oct | 2-May | 8-Feb | 2-Sep | 11-Jun |
| 3-Jan | 12-Oct | 3-May | 9-Feb | 3-Sep | 12-Jun |
| 4-Jan | 13-Oct | 4-May | 10-Feb | 4-Sep | 13-Jun |
| 5-Jan | 14-Oct | 5-May | 11-Feb | 5-Sep | 14-Jun |
| 6-Jan | 15-Oct | 6-May | 12-Feb | 6-Sep | 15-Jun |
| 7-Jan | 16-Oct | 7-May | 13-Feb | 7-Sep | 16-Jun |
| 8-Jan | 17-Oct | 8-May | 14-Feb | 8-Sep | 17-Jun |
| 9-Jan | 18-Oct | 9-May | 15-Feb | 9-Sep | 18-Jun |
| 10-Jan | 19-Oct | 10-May | 16-Feb | 10-Sep | 19-Jun |
| 11-Jan | 20-Oct | 11-May | 17-Feb | 11-Sep | 20-Jun |
| 12-Jan | 21-Oct | 12-May | 18-Feb | 12-Sep | 21-Jun |
| 13-Jan | 22-Oct | 13-May | 19-Feb | 13-Sep | 22-Jun |
| 14-Jan | 23-Oct | 14-May | 20-Feb | 14-Sep | 23-Jun |
| 15-Jan | 24-Oct | 15-May | 21-Feb | 15-Sep | 24-Jun |
| 16-Jan | 25-Oct | 16-May | 22-Feb | 16-Sep | 25-Jun |
| 17-Jan | 26-Oct | 17-May | 23-Feb | 17-Sep | 26-Jun |
| 18-Jan | 27-Oct | 18-May | 24-Feb | 18-Sep | 27-Jun |
| 19-Jan | 28-Oct | 19-May | 25-Feb | 19-Sep | 28-Jun |
| 20-Jan | 29-Oct | 20-May | 26-Feb | 20-Sep | 29-Jun |
| 21-Jan | 30-Oct | 21-May | 27-Feb | 21-Sep | 30-Jun |
| 22-Jan | 31-Oct | 22-May | 28-Feb | 22-Sep | 1-Jul |
| 23-Jan | 1-Nov | 23-May | 29-Feb | 23-Sep | 2-Jul |
| 24-Jan | 2-Nov | 24-May | 1-Mar | 24-Sep | 3-Jul |
| 25-Jan | 3-Nov | 25-May | 2-Mar | 25-Sep | 4-Jul |
| 26-Jan | 4-Nov | 26-May | 3-Mar | 26-Sep | 5-Jul |
| 27-Jan | 5-Nov | 27-May | 4-Mar | 27-Sep | 6-Jul |
| 28-Jan | 6-Nov | 28-May | 5-Mar | 28-Sep | 7-Jul |
| 29-Jan | 7-Nov | 29-May | 6-Mar | 29-Sep | 8-Jul |
| 30-Jan | 8-Nov | 30-May | 7-Mar | 30-Sep | 9-Jul |
| 31-Jan | 9-Nov | 31-May | 8-Mar | ||
| 1-Feb | 10-Nov | 1-Jun | 9-Mar | 1-Oct | 10-Jul |
| 2-Feb | 11-Nov | 2-Jun | 10-Mar | 2-Oct | 11-Jul |
| 3-Feb | 12-Nov | 3-Jun | 11-Mar | 3-Oct | 12-Jul |
| 4-Feb | 13-Nov | 4-Jun | 12-Mar | 4-Oct | 13-Jul |
| 5-Feb | 14-Nov | 5-Jun | 13-Mar | 5-Oct | 14-Jul |
| 6-Feb | 15-Nov | 6-Jun | 14-Mar | 6-Oct | 15-Jul |
| 7-Feb | 16-Nov | 7-Jun | 15-Mar | 7-Oct | 16-Jul |
| 8-Feb | 17-Nov | 8-Jun | 16-Mar | 8-Oct | 17-Jul |
| 9-Feb | 18-Nov | 9-Jun | 17-Mar | 9-Oct | 18-Jul |
| 10-Feb | 19-Nov | 10-Jun | 18-Mar | 10-Oct | 19-Jul |
| 11-Feb | 20-Nov | 11-Jun | 19-Mar | 11-Oct | 20-Jul |
| 12-Feb | 21-Nov | 12-Jun | 20-Mar | 12-Oct | 21-Jul |
| 13-Feb | 22-Nov | 13-Jun | 21-Mar | 13-Oct | 22-Jul |
| 14-Feb | 23-Nov | 14-Jun | 22-Mar | 14-Oct | 23-Jul |
| 15-Feb | 24-Nov | 15-Jun | 23-Mar | 15-Oct | 24-Jul |
| 16-Feb | 25-Nov | 16-Jun | 24-Mar | 16-Oct | 25-Jul |
| 17-Feb | 26-Nov | 17-Jun | 25-Mar | 17-Oct | 26-Jul |
| 18-Feb | 27-Nov | 18-Jun | 26-Mar | 18-Oct | 27-Jul |
| 19-Feb | 28-Nov | 19-Jun | 27-Mar | 19-Oct | 28-Jul |
| 20-Feb | 29-Nov | 20-Jun | 28-Mar | 20-Oct | 29-Jul |
| 21-Feb | 30-Nov | 21-Jun | 29-Mar | 21-Oct | 30-Jul |
| 22-Feb | 1-Dec | 22-Jun | 30-Mar | 22-Oct | 31-Jul |
| 23-Feb | 2-Dec | 23-Jun | 31-Mar | 23-Oct | 1-Aug |
| 24-Feb | 3-Dec | 24-Jun | 1-Apr | 24-Oct | 2-Aug |
| 25-Feb | 4-Dec | 25-Jun | 2-Apr | 25-Oct | 3-Aug |
| 26-Feb | 5-Dec | 26-Jun | 3-Apr | 26-Oct | 4-Aug |
| 27-Feb | 6-Dec | 27-Jun | 4-Apr | 27-Oct | 5-Aug |
| 28-Feb | 7-Dec | 28-Jun | 5-Apr | 28-Oct | 6-Aug |
| 29-Jun | 6-Apr | 29-Oct | 7-Aug | ||
| 30-Jun | 7-Apr | 30-Oct | 8-Aug | ||
| 31-Oct | 9-Aug | ||||
| Date of Service | Calf Due Date | Date of Service | Calf Due Date | Date of Service | Calf Due Date |
| 1-Mar | 8-Dec | 1-Jul | 9-Apr | 1-Nov | 10-Aug |
| 2-Mar | 9-Dec | 2-Jul | 10-Apr | 2-Nov | 11-Aug |
| 3-Mar | 10-Dec | 3-Jul | 11-Apr | 3-Nov | 12-Aug |
| 4-Mar | 11-Dec | 4-Jul | 12-Apr | 4-Nov | 13-Aug |
| 5-Mar | 12-Dec | 5-Jul | 13-Apr | 5-Nov | 14-Aug |
| 6-Mar | 13-Dec | 6-Jul | 14-Apr | 6-Nov | 15-Aug |
| 7-Mar | 14-Dec | 7-Jul | 15-Apr | 7-Nov | 16-Aug |
| 8-Mar | 15-Dec | 8-Jul | 16-Apr | 8-Nov | 17-Aug |
| 9-Mar | 16-Dec | 9-Jul | 17-Apr | 9-Nov | 18-Aug |
| 10-Mar | 17-Dec | 10-Jul | 18-Apr | 10-Nov | 19-Aug |
| 11-Mar | 18-Dec | 11-Jul | 19-Apr | 11-Nov | 20-Aug |
| 12-Mar | 19-Dec | 12-Jul | 20-Apr | 12-Nov | 21-Aug |
| 13-Mar | 20-Dec | 13-Jul | 21-Apr | 13-Nov | 22-Aug |
| 14-Mar | 21-Dec | 14-Jul | 22-Apr | 14-Nov | 23-Aug |
| 15-Mar | 22-Dec | 15-Jul | 23-Apr | 15-Nov | 24-Aug |
| 16-Mar | 23-Dec | 16-Jul | 24-Apr | 16-Nov | 25-Aug |
| 17-Mar | 24-Dec | 17-Jul | 25-Apr | 17-Nov | 26-Aug |
| 18-Mar | 25-Dec | 18-Jul | 26-Apr | 18-Nov | 27-Aug |
| 19-Mar | 26-Dec | 19-Jul | 27-Apr | 19-Nov | 28-Aug |
| 20-Mar | 27-Dec | 20-Jul | 28-Apr | 20-Nov | 29-Aug |
| 21-Mar | 28-Dec | 21-Jul | 29-Apr | 21-Nov | 30-Aug |
| 22-Mar | 29-Dec | 22-Jul | 30-Apr | 22-Nov | 31-Aug |
| 23-Mar | 30-Dec | 23-Jul | 1-May | 23-Nov | 1-Sep |
| 24-Mar | 31-Dec | 24-Jul | 2-May | 24-Nov | 2-Sep |
| 25-Mar | 1-Jan | 25-Jul | 3-May | 25-Nov | 3-Sep |
| 26-Mar | 2-Jan | 26-Jul | 4-May | 26-Nov | 4-Sep |
| 27-Mar | 3-Jan | 27-Jul | 5-May | 27-Nov | 5-Sep |
| 28-Mar | 4-Jan | 28-Jul | 6-May | 28-Nov | 6-Sep |
| 29-Mar | 5-Jan | 29-Jul | 7-May | 29-Nov | 7-Sep |
| 30-Mar | 6-Jan | 30-Jul | 8-May | 30-Nov | 8-Sep |
| 31-Mar | 7-Jan | 31-Jul | 9-May | ||
| 1-Apr | 8-Jan | 1-Aug | 10-May | 1-Dec | 9-Sep |
| 2-Apr | 9-Jan | 2-Aug | 11-May | 2-Dec | 10-Sep |
| 3-Apr | 10-Jan | 3-Aug | 12-May | 3-Dec | 11-Sep |
| 4-Apr | 11-Jan | 4-Aug | 13-May | 4-Dec | 12-Sep |
| 5-Apr | 12-Jan | 5-Aug | 14-May | 5-Dec | 13-Sep |
| 6-Apr | 13-Jan | 6-Aug | 15-May | 6-Dec | 14-Sep |
| 7-Apr | 14-Jan | 7-Aug | 16-May | 7-Dec | 15-Sep |
| 8-Apr | 15-Jan | 8-Aug | 17-May | 8-Dec | 16-Sep |
| 9-Apr | 16-Jan | 9-Aug | 18-May | 9-Dec | 17-Sep |
| 10-Apr | 17-Jan | 10-Aug | 19-May | 10-Dec | 18-Sep |
| 11-Apr | 18-Jan | 11-Aug | 20-May | 11-Dec | 19-Sep |
| 12-Apr | 19-Jan | 12-Aug | 21-May | 12-Dec | 20-Sep |
| 13-Apr | 20-Jan | 13-Aug | 22-May | 13-Dec | 21-Sep |
| 14-Apr | 21-Jan | 14-Aug | 23-May | 14-Dec | 22-Sep |
| 15-Apr | 22-Jan | 15-Aug | 24-May | 15-Dec | 23-Sep |
| 16-Apr | 23-Jan | 16-Aug | 25-May | 16-Dec | 24-Sep |
| 17-Apr | 24-Jan | 17-Aug | 26-May | 17-Dec | 25-Sep |
| 18-Apr | 25-Jan | 18-Aug | 27-May | 18-Dec | 26-Sep |
| 19-Apr | 26-Jan | 19-Aug | 28-May | 19-Dec | 27-Sep |
| 20-Apr | 27-Jan | 20-Aug | 29-May | 20-Dec | 28-Sep |
| 21-Apr | 28-Jan | 21-Aug | 30-May | 21-Dec | 29-Sep |
| 22-Apr | 29-Jan | 22-Aug | 31-May | 22-Dec | 30-Sep |
| 23-Apr | 30-Jan | 23-Aug | 1-Jun | 23-Dec | 1-Oct |
| 24-Apr | 31-Jan | 24-Aug | 2-Jun | 24-Dec | 2-Oct |
| 25-Apr | 1-Feb | 25-Aug | 3-Jun | 25-Dec | 3-Oct |
| 26-Apr | 2-Feb | 26-Aug | 4-Jun | 26-Dec | 4-Oct |
| 27-Apr | 3-Feb | 27-Aug | 5-Jun | 27-Dec | 5-Oct |
| 28-Apr | 4-Feb | 28-Aug | 6-Jun | 28-Dec | 6-Oct |
| 29-Apr | 5-Feb | 29-Aug | 7-Jun | 29-Dec | 7-Oct |
| 30-Apr | 6-Feb | 30-Aug | 8-Jun | 30-Dec | 8-Oct |
| 31-Aug | 9-Jun | 31-Dec | 9-Oct |
Not an exact science
The chart is based on a 283-day gestation period. But in reality, gestation periods for cows can range from about 279 to 287 days.
This means the chart provides a good average, but individual cows might calve a few days earlier or later than the predicted date. Experienced ranchers often know this and keep an eye on their cows for signs of labor starting a bit before or after the predicted date.
Some factors that can affect gestation length include:
- The breed of cattle
- Whether it’s a bull or heifer calf (bull calves often have slightly longer gestation)
- The age and health of the mother cow
So while the chart is a very useful tool, it’s not an exact science. ranchers still rely on their experience and observation skills alongside this handy guide.
Accounting for leap years
The cattle gestation chart is designed to account for leap years without explicitly mentioning them. If you look closely, you’ll see that the chart stops at February 28 and then continues to March 1, with no February 29 listed.
This design choice allows the chart to be accurate for both regular and leap years. In a non-leap year, it works as is. In a leap year, ranchers simply need to add one day to all the dates from March 1 onward.
Cattle gestation charts come in various formats, from simple printed tables to more advanced digital tools. Regardless of the format, their primary function remains the same: to tell you when the calf is due.
Benefits of cattle gestation charts

There are three main benefits of the cattle gestation chart:
- Easy Date Finding: The biggest help of this chart is that it does the math for you. You just need to know when the cow was bred. Find that date on the chart, and it shows you when the calf will likely be born. No need to count days or use a calculator. It’s quick and simple.
- Planning Ahead: Knowing when calves will be born helps ranchers plan. They can get ready for busy times. For example, they might need extra help when lots of calves are due. Or they can make sure they have enough space ready for new calves. The chart doesn’t do the work, but it tells ranchers when to be prepared.
- Feeding Guide: The chart can remind ranchers when cows might need different food. Cows need more food near the end of pregnancy. By looking at the due date, ranchers know when to start giving more food. The chart doesn’t tell what food to give, but it shows when changes might be needed.
Remember, the chart just gives dates. It’s up to the rancher to use this information to take care of the cows and plan the work. The main help is saving time on figuring out dates, which makes other jobs easier to plan.
Use it for reverse planning
One interesting aspect of this cattle gestation chart that you might not know is its versatility in reverse planning. While most people use it to find the calving date based on the breeding date, you can also use it backward.
If you have a specific time they want calves to be born — maybe to match good weather or market conditions — they can start with the desired calving date and work backward to figure out when to breed the cows. For example, if you want calves born in early April for spring grazing, they can look at the April dates in the “Calf Due” column and then read across to find the corresponding breeding dates in the previous year’s June or July.
This reverse use can be really helpful for planning breeding seasons and managing the timing of the herd’s reproductive cycle. It’s a simple feature, but it adds flexibility to how ranchers can use the chart to plan their operations.
A tool to keep record of calf due dates and other data
CattleMax is the #1 ranch record keeping software program in the cattle industry. It’s easy-to-use. Keeps you organized. And helps you better manage your operation. Plus, CattleMax lets you access every bit of information you need whether you’re at your desk or out in the field. If you need help, every CattleMax customer service representative is a real rancher, who uses CattleMax every day on their own operation. Best of all, you can try CattleMax risk-free, with our 21-Day Free Trial Program. You can even schedule a 30-minute personal demo to get you started.
Streamline Your Cattle Management with CattleMax

While cattle gestation charts are undoubtedly useful, modern ranchers need comprehensive solutions for efficient ranch management. This is where CattleMax comes in.
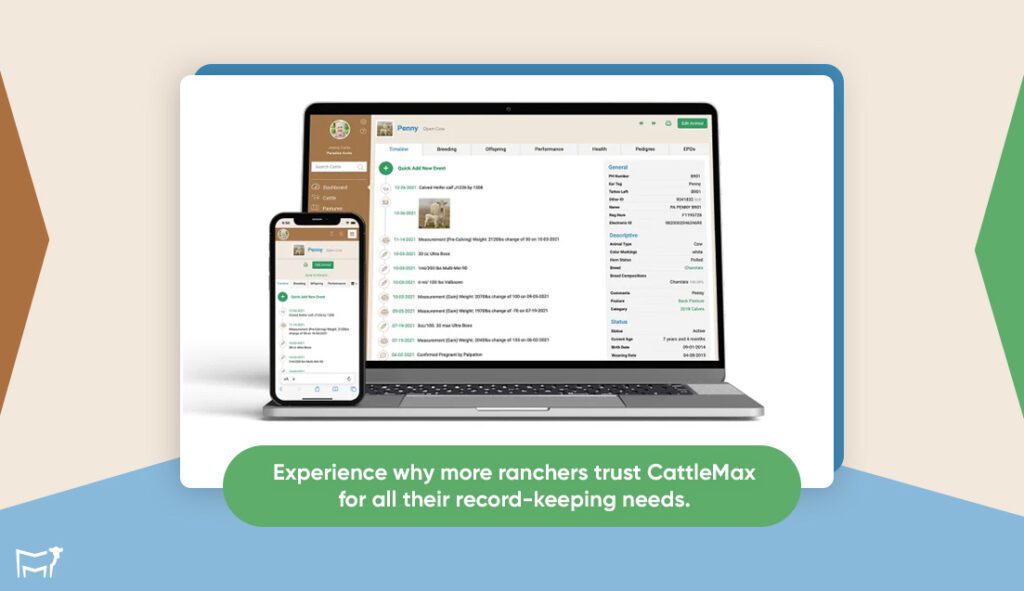
CattleMax is a record keeping software built for ranchers. It’s easy to use, keeps you organized, and helps you better manage your entire operation. With CattleMax, you can access every bit of information you need, whether you’re at your desk or out in the field.
What sets CattleMax apart is its comprehensive approach. It doesn’t just handle gestation tracking – it manages sale records, pasture management, equipment maintenance, and everything in between. Plus, being cloud-based means you’ll never lose another record and can access all your information from your phone, tablet, or computer from just about anyplace on Earth.
Want to see how CattleMax can revolutionize your ranch management? Try it risk-free with our 21-day free trial offer. You can even schedule a 30-minute personal demo to get you started. Experience why more ranchers trust CattleMax for all their record-keeping needs.

Jacqueline
Jacqueline, a true Wyoming native, was raised on her family's ranch just north of Cheyenne. Her journey led her to the University of Wyoming, where she earned a Bachelor of Business Administration in Management and Marketing. She and her husband, Darrell, manage a thriving herd of commercial Angus cattle.

